
That’s a Question We’re Going to Continue Answering in This Week’s Solution
Previously we discussed the importance of building your business on a solid foundation and how it can prevent your business from falling down around you. We talked about the different parts of that foundation and their purpose.

Next, we talked about construction companies that are avoiding these foundational building blocks because they are out of their comfort zone. It’s amazing how people in the construction industry will use all sorts of power tools and equipment but are afraid of paperwork.
Then we began breaking down the “Job List”…one of those foundational building blocks. In that post we looked at how it can tell you…
- Which types of work were consistently the most profitable
- How you were doing at meeting your financial goals for the year
- When you should have the signed projects finished to stay on track
- How well you’re doing at getting proposals signed
- What the average price of your projects are
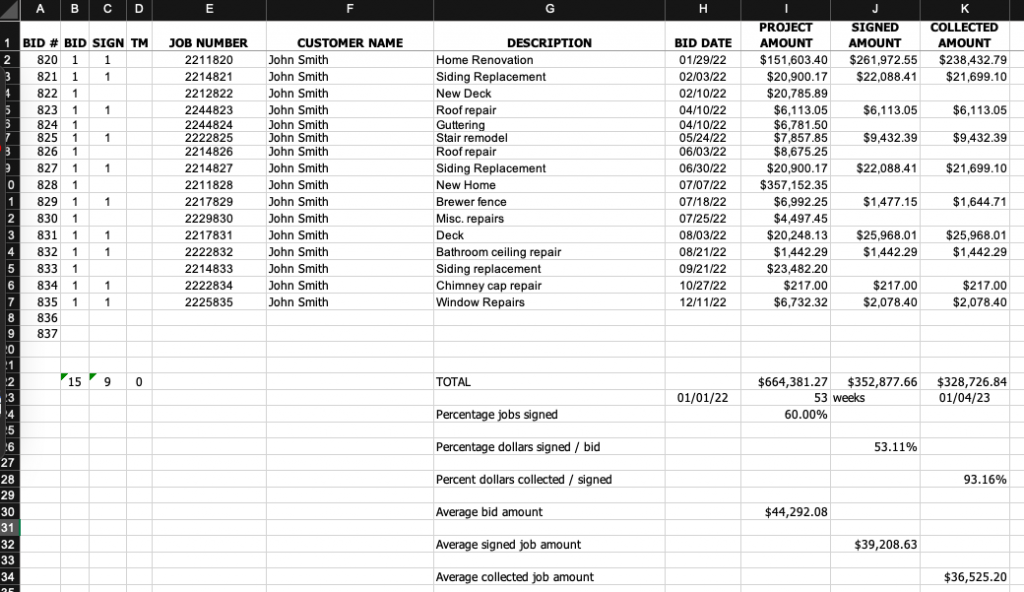
We began with how the “Job List” can help with creating and recording project numbers, tracking project bid amounts and tracking dollars of signed proposals.
Now let’s continue looking at how the “Job List” can help us plan for the future.
When we look at the total project bid amount and the total signed amount we can see where we are in relation to our financial goals for the year. (See the previous post for more details on this).
Next is…
Tracking dollars collected from projects – This collected amount (column K) is exactly what it says it is. It is where we enter the amounts collected from each project weekly. This total gives us a comparison to our signed amount (column J) and let’s us see if our projects have increased or decreased after signing.
Percentage of jobs signed – This percentage, 60% (cell I-24) is the percentage of proposals that have been signed. This is cell B-22 (15) divided by cell C-22 (9). This information lets us know how we’re doing with our pricing. If the number is below 15%, we’re not selling well. If our number gets too high, above 50%, we may not be charging enough.
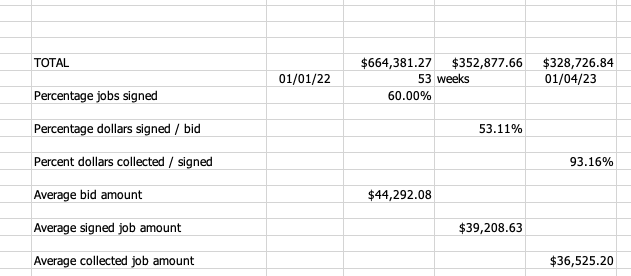
Percentage of dollars signed per dollars bid – Knowing this percentage helps us as we’re looking forward, to know how we’re doing in relation to reaching our financial goal for the year. Based on the percentage of 53% (cell J-26), knowing that if our goal for the year is $400,000.00, we need to have done twice that many dollars of proposals.
Percentage of dollars collected per signed – Just like tracking the amount of dollars collected is pretty straight forward, this percentage of 93% (cell K-28), is the same. This simply lets us know if we’ve collected everything that was bid. If not, there may be some outstanding receivables, or we may have made changes during production that reduced our receivables number. It’s also possible for this number to be more than 100% which means that there were changes made during production that increased our receivables.
There are still five more areas of information that the “Job List” provides but to keep this post from getting too long today, I’m going to stop here. I know that this feels like a lot but it’s not nearly as overwhelming as it seems.
Just like there’s a lot to constructing a building, the same is true for building a successful business.
The five remaining areas are –

- Average dollar amount of projects bid
- Average dollar amount of projects signed
- Average dollar amount of projects collected
- Projected timeframe for doing signed projects
- Projected date work should be done
Of these next five areas I think the last two are the most revealing.
I’m looking forward to bringing this “Job List” topic to a close in the next post.